

The DXY chart is a widely followed index that tracks the strength of the US dollar against a basket of other major currencies. As a trader, understanding the dynamics of the DXY chart is crucial for making informed decisions in the foreign exchange market. In this comprehensive guide, we will decode the DXY chart and provide you with the necessary information to make better trading decisions.
What is the DXY chart?
The DXY chart is an index that tracks the value of the US dollar against a basket of six other major currencies: the euro, Japanese yen, British pound, Canadian dollar, Swedish krona, and Swiss franc. The US Federal Reserve created the index in 1973 as a tool to track the strength of the US dollar in the global economy.
The DXY chart is a weighted average of the exchange rates of the six currencies against the US dollar. The weighting is based on the trade flows between the US and other countries. For example, the euro has the highest weighting in the index, representing approximately 57.6% of the basket.
How to Read the DXY Chart
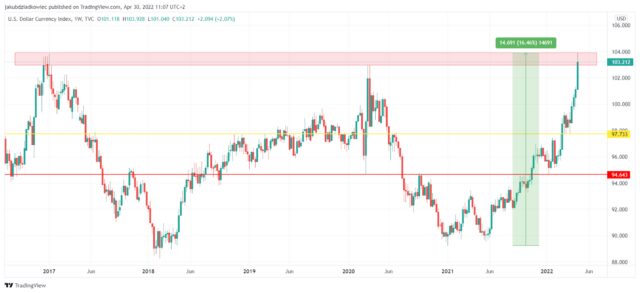
A line graph that depicts the movement of the index over time serves as the DXY chart’s representation.esentation. The value of the index is represented on the y-axis, while the time period is represented on the x-axis. Each point on the line represents the DXY value at a specific time, reflecting the US dollar’s performance against the currency basket.
When the DXY chart is trending upwards, it indicates that the US dollar is strengthening against the other currencies in the basket. This is often due to factors such as positive economic data from the US or a rising interest rate environment. Conversely, when the DXY chart is trending downward, it indicates that the US dollar is weakening against other currencies. This might be a result of weaker economic indicators in the US or a decrease in interest rates.
Factors Affecting the DXY Chart
Several factors can influence the movement of the DXY chart. One of the most significant factors is the monetary policy of the US Federal Reserve. When the Fed raises interest rates, it makes the US dollar more attractive to investors, leading to a strengthening of the currency.
Another factor that can influence the DXY chart is the global economic outlook. When the global economy is performing well, investors tend to move their money out of safe-haven assets such as the US dollar and into riskier assets such as stocks and commodities. This can lead to a weakening of the US dollar.
Geopolitical events can also have an impact on the DXY chart. For example, political instability in a major economy can lead to a flight to safety, causing investors to move their money into safe-haven assets such as the US dollar.

Trading Strategies for the DXY Chart
As a trader, there are several strategies you can use to trade the DXY chart. One of the most popular strategies is to use technical analysis to identify trends and trading opportunities.
Technical analysis involves studying the historical price and volume data of the DXY chart to identify patterns and trends. Traders can use indicators such as moving averages, Bollinger Bands, and the Relative Strength Index (RSI) to identify potential buy or sell signals.
Another trading strategy is to use fundamental analysis to assess the underlying factors that can affect the movement of the DXY chart. This involves analyzing economic data such as gross domestic product (GDP), inflation, and employment figures to gain insights into the health of the US economy and the likely direction of the US dollar.
Tips for Using the DXY Chart
To make the most of the DXY chart, here are a few tips to keep in mind:
- Keep an eye on the global economic outlook: As mentioned earlier, the global economic outlook can have a significant impact on the movement of the DXY chart. Be sure to keep an eye on economic indicators and news releases that can affect the global economy.
- Use multiple timeframes: To get a better understanding of the overall trend of the DXY chart, use multiple timeframes. This can help you identify long-term trends as well as short-term trading opportunities.
- Incorporate other indicators: While the DXY chart is a valuable tool, it’s always a good idea to incorporate other indicators into your trading strategy. Consider using technical indicators or other fundamental data to confirm your trading signals.
By incorporating these tips into your trading strategy, you can maximize the benefits of the DXY chart and improve your chances of success in the foreign exchange market.
Understanding the DXY Chart in Different Market Conditions
This section would shed light on how the DXY chart behaves in various market scenarios such as bull markets, bear markets, and periods of high volatility. By studying the DXY chart’s responses to these conditions, traders can form more comprehensive strategies for different market environments.
DXY Chart and its Correlation with Other Markets
In this part, we will explore the relationship between the DXY chart and other financial markets, such as commodities, equities, and bond markets. Understanding these correlations can provide traders with a more holistic view of the market and allow them to make more informed trading decisions.

Risk Management in DXY Trading
The final section would focus on the importance of risk management in DXY trading. It would provide tips and strategies for managing risks, such as setting stop-loss orders and diversifying portfolios, to ensure that traders maintain a sustainable trading strategy despite the potential fluctuations in the DXY chart.
Final Thoughts
Decoding the DXY chart can be challenging, but with the right knowledge and tools, traders can gain valuable insights into the health of the US economy and the direction of the US dollar.
Whether you’re a beginner or an experienced trader, understanding the factors that can influence the movement of the DXY chart is crucial for making informed trading decisions.
By incorporating the DXY chart into your trading strategy and keeping up-to-date with the latest economic news and indicators, you can improve your chances of success in the foreign exchange market.


